Predictive maintenance is one of the key maintenance strategies when it comes to optimize the assets reliability. There are various strategies or mathematical tools that are used to achieve the results. One of the key and simple mathematical tool is Probability Density Function.
Probability density functions (PDFs) are a critical tool for the manufacturing industry, enabling the accurate modelling and prediction of key manufacturing processes. By analysing and understanding the probability distribution of manufacturing data, manufacturers can make more informed decisions about production, quality control, and process optimization.
The PDF allows manufacturers to understand how frequently different values of the random variable occur, and to calculate the likelihood of the variable taking a specific value. PDFs are often used to model complex manufacturing processes, such as the distribution of defects in a particular product, or the temperature distribution within a furnace.
Example:
One of the vital use of PDFs is to identify anomaly in the process variable. Let's consider the servo drive mechanism. In order to increase the reliability and robustness of the drive, it is important to continuously monitor the functional parameters like Torque.
Both internal and external disturbances may result into change in Torque there by decreasing the motor performance. These disturbances could be external force or an internal mechanical defects. With the help of PDF analysis, we can easily identify the probability of occurrence of nominal process value (Torque in this case). This will help us to understand the distribution of the process value. In the picture below, this is the case where there is no external disturbances and is the nominal operating range. Here, The Torque is around 2.5 with the probability of around 0.7. However looking into the distribution curve it is around 0.4
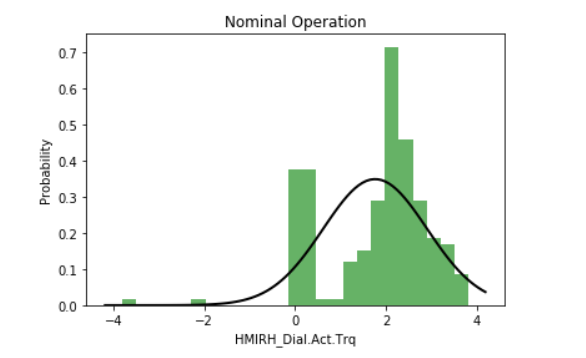
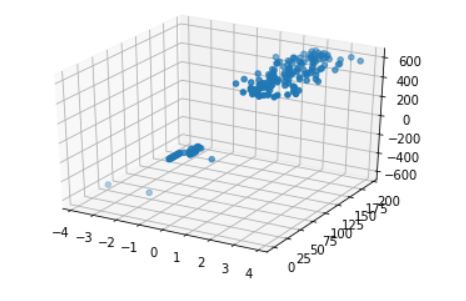
Now, let's look into the situation where system starts showing abnormal behaviour or intermittent fault. The result will look like as below.

Now when there is a slight intermittent fault you can see the probability of occurrence of nominal torque value is dropped down to around 0.5 where as the normal distribution depicts that it is around 0.125. And those intermittent fault leads to increase in Torque as well as shown in the graph.
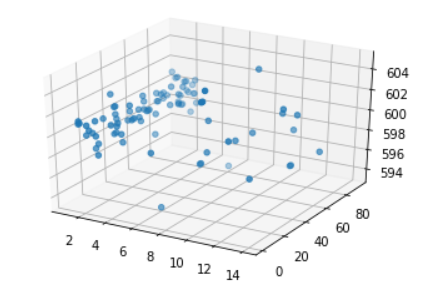
Now, let's look more into the continuous fault or continuous abnormality on the system.
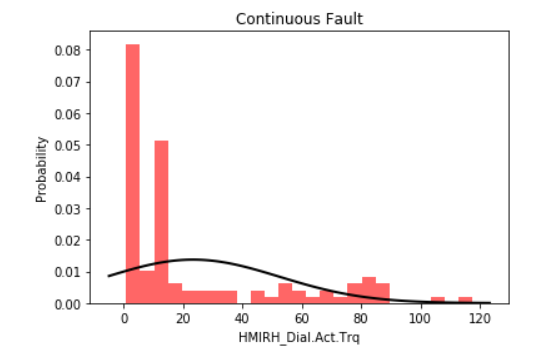
With continuous fault, the probability of occurrence of nominal torque is dropped down to 0.08 and the normal distribution is around 0.0125.
These values now tell us the early detection of the issues (specially the intermittent scenario).
Hence the simple probability density function will help us to understand any potential hazard to the machine at earlier stage.